Navigators
Deploy and collect nodes in teams.
- What have I got left to do?
- Am I working on the right piece of work?

Case study · STRYDE
Navigating locations beyond traditional maps.
01 Context
STRYDE, a pioneer in seismic imaging technology, set out to make this complex field accessible to a wider range of industries beyond oil and gas.
As a UX designer at STRYDE, I worked across software platforms with a team of expert engineers. Our mission: modernise seismic imaging software to make it affordable, user-friendly and highly efficient for a diverse range of clients.
02 The challenge
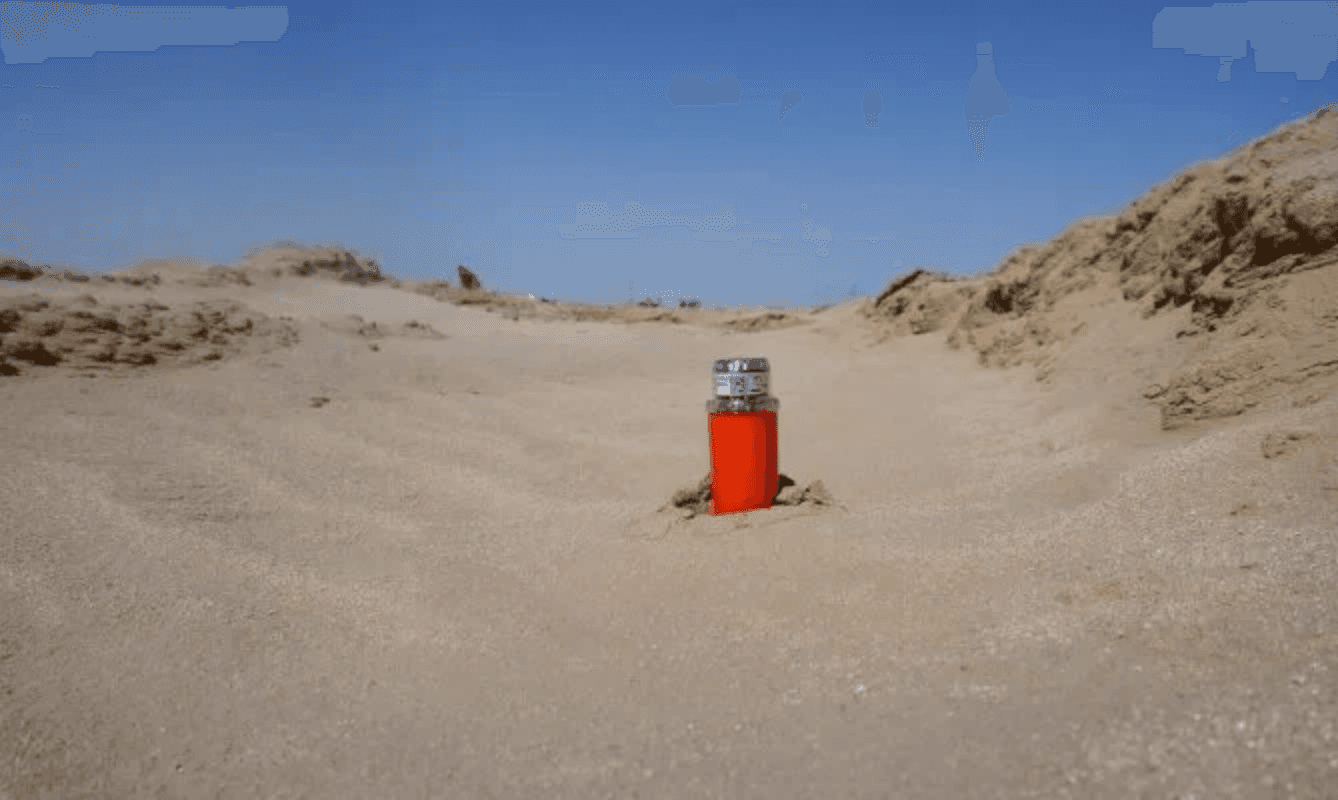
Nodes, often numbering in the hundreds of thousands, are deployed with centimetre accuracy across deserts, forests, mountains and even Antarctica.
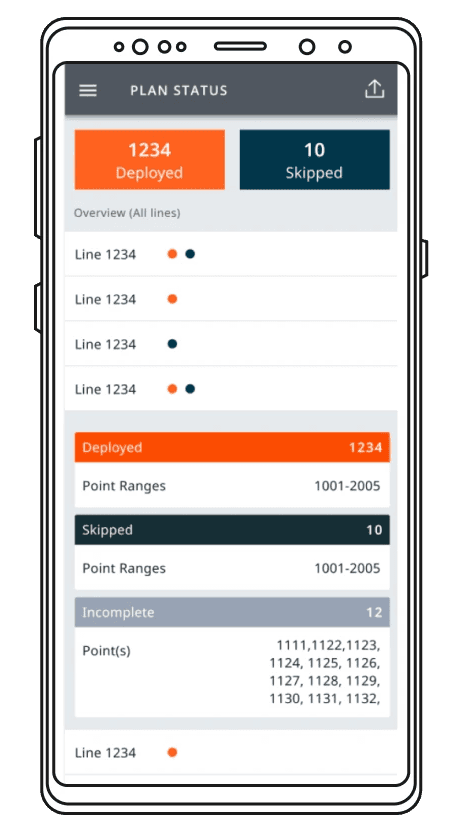
Our plan status screen had been rated ‘not usable’. It didn’t help people do their jobs, and the data had to be massively manipulated to make sense. It needed an overhaul.
03 Discovery
I began by working closely with our field support team, who manage STRYDE systems with our clients in the field. From this I:
As the sole designer, I had to think about how we might aid deployment by:
This ensures comprehensive analysis of the land being surveyed, and accurate data.
“I don’t care about what has been done, I need to know what is left to do.”
Deploy and collect nodes in teams.
Manage and organise the Navigator teams.
Survey QC.

04 Design
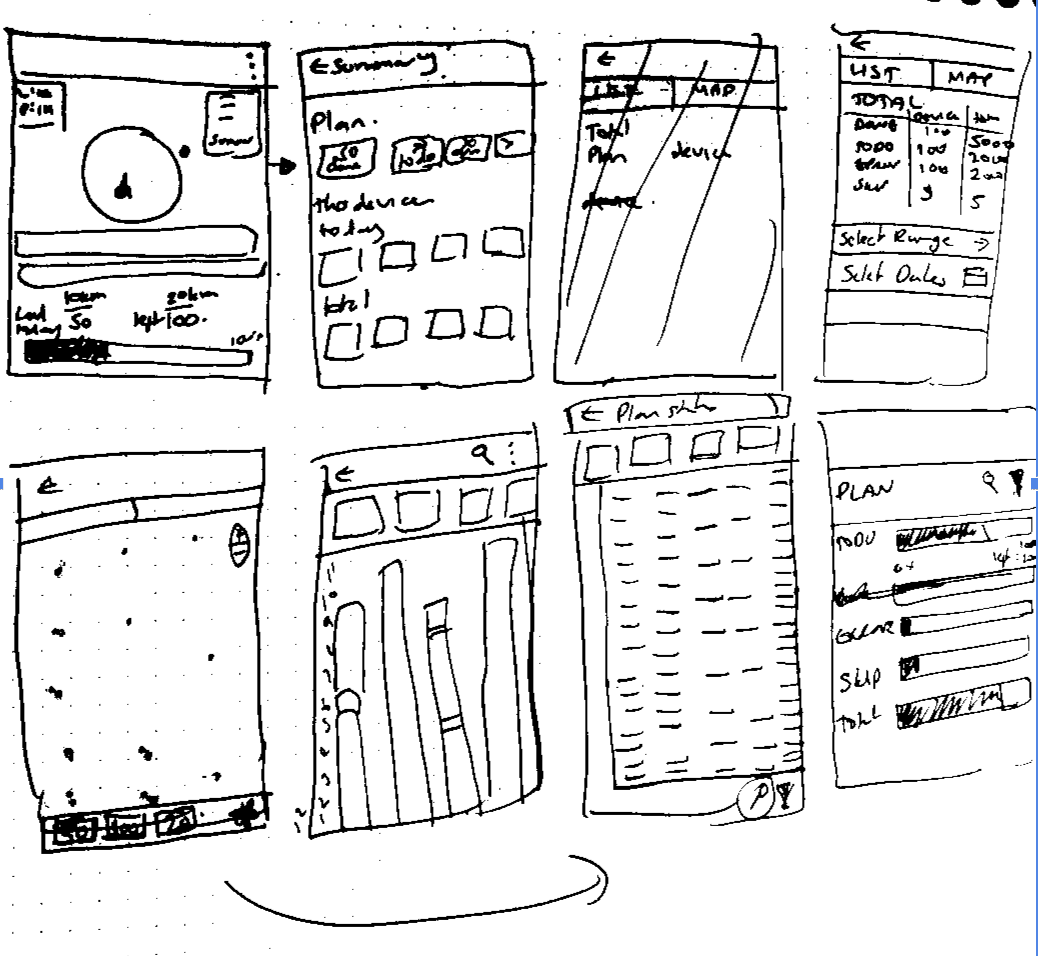
I started with sketches, presented in early meetings with the field support team. They responded to questions from those conversations: how much work remained, how long it was taking, and how to present a better summary. I also considered whether a map-like visualisation, like OpenTable’s, might work better, and whether progress bars beat numbers.
The brief became:
I focused on refining these ideas, hoping to uncover usability issues quickly through prototypes.
05 Learnings
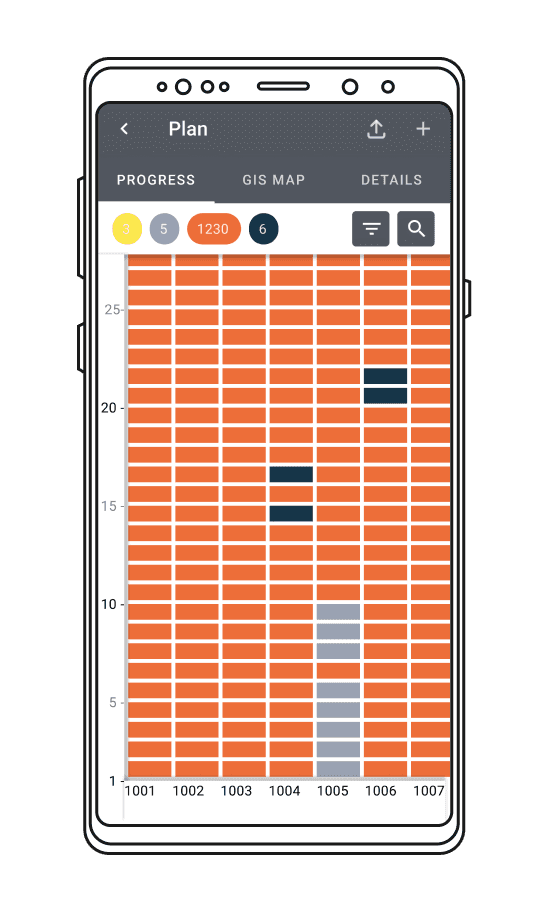
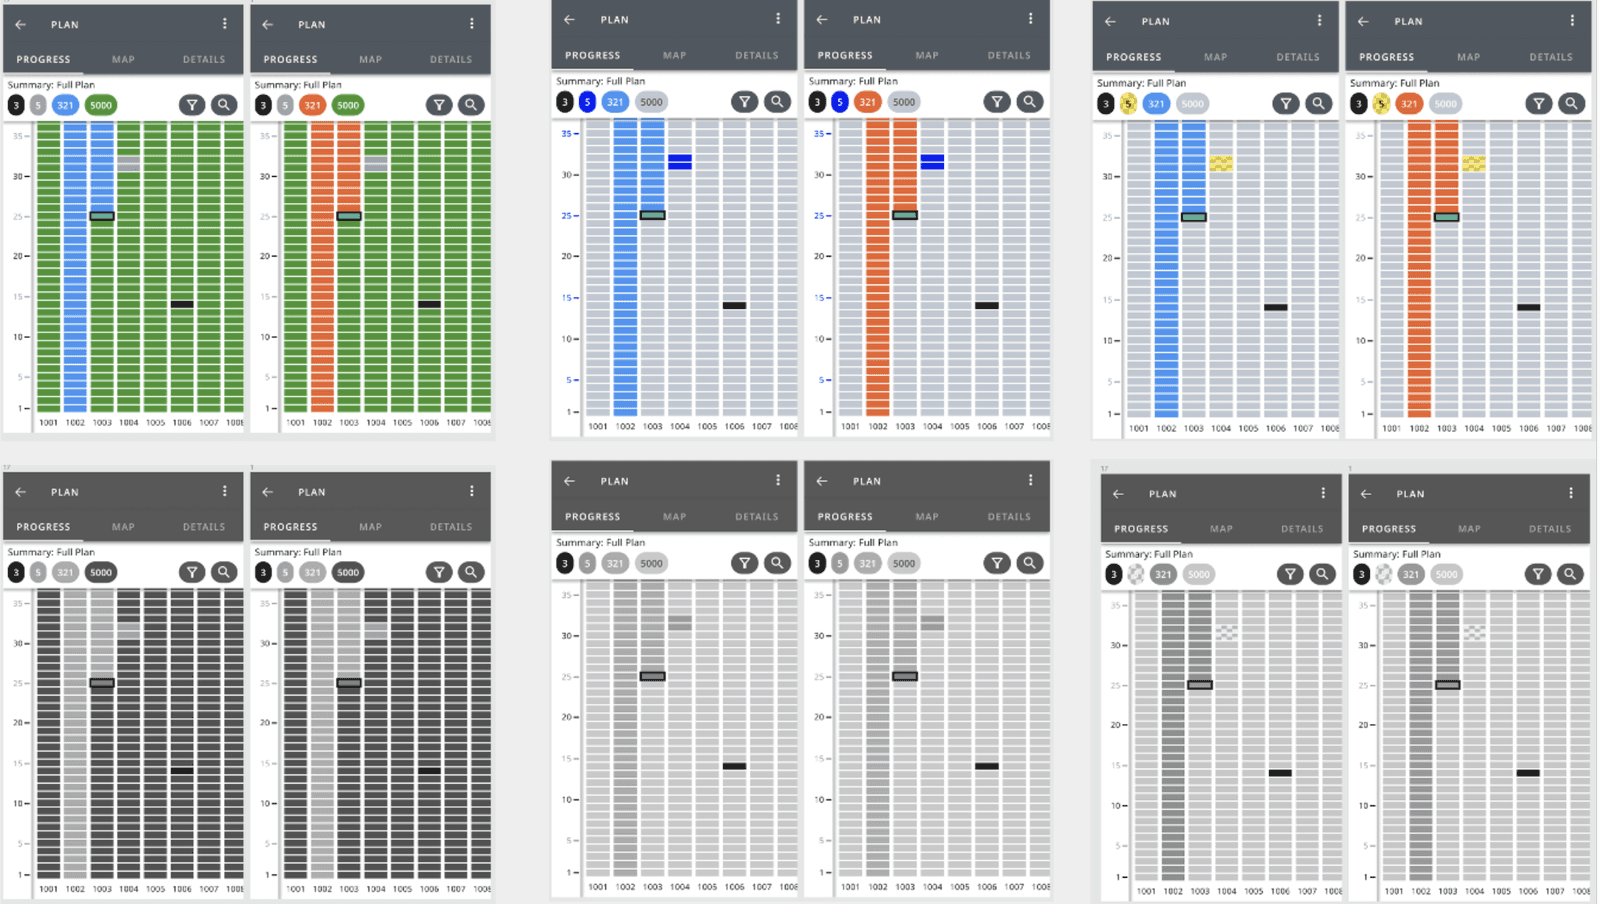
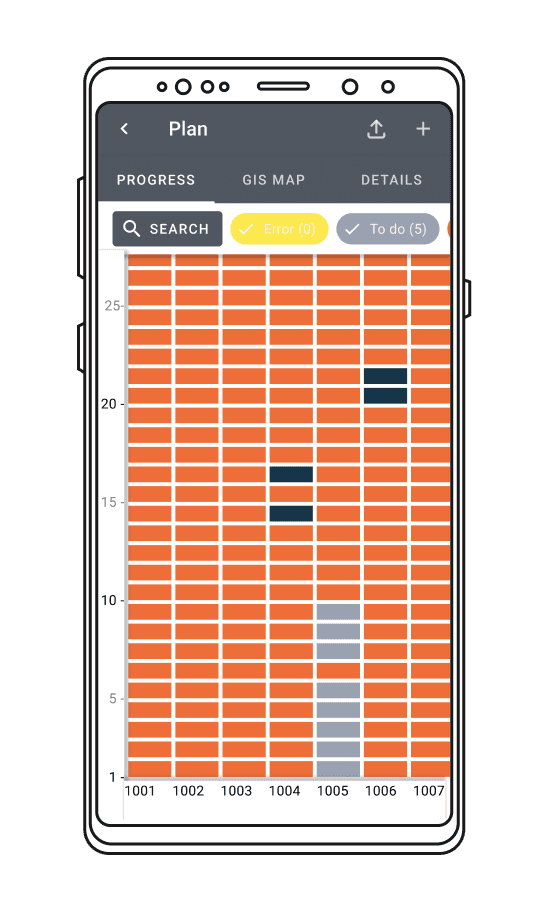
For our users, the relationship between the vertical and horizontal axes was crucial for visualising plans in the field, so the assumed vertical scrolling didn’t work.
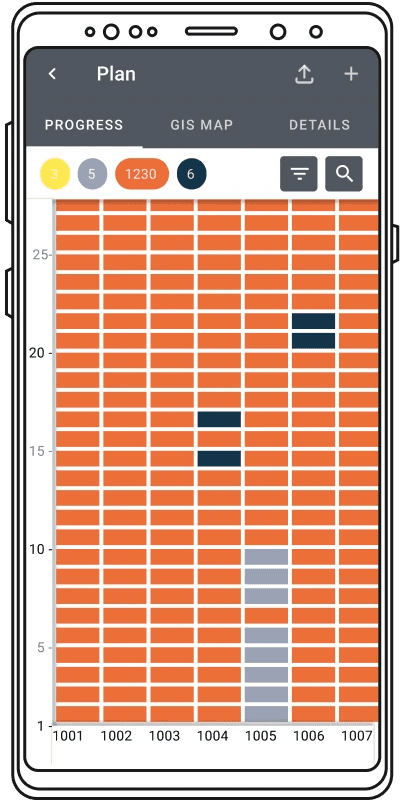
We changed the layout to match how Data Officers and Foremen picture their plans: a grid with an X and Y axis, starting at 0,0.
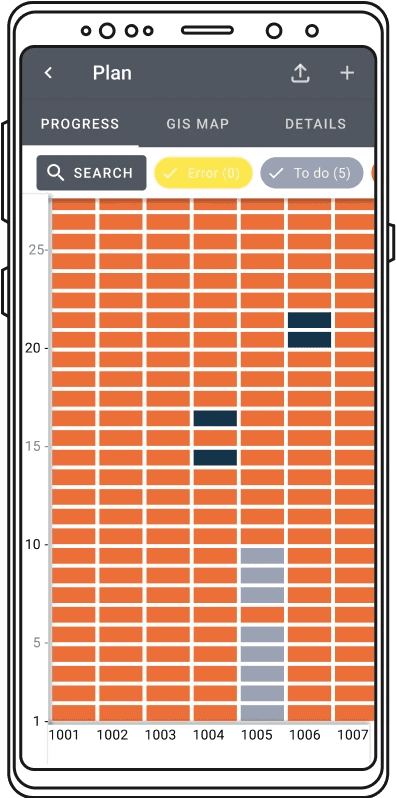
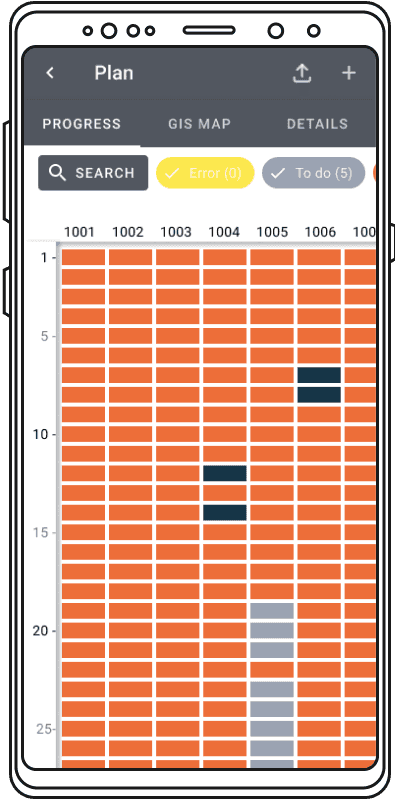
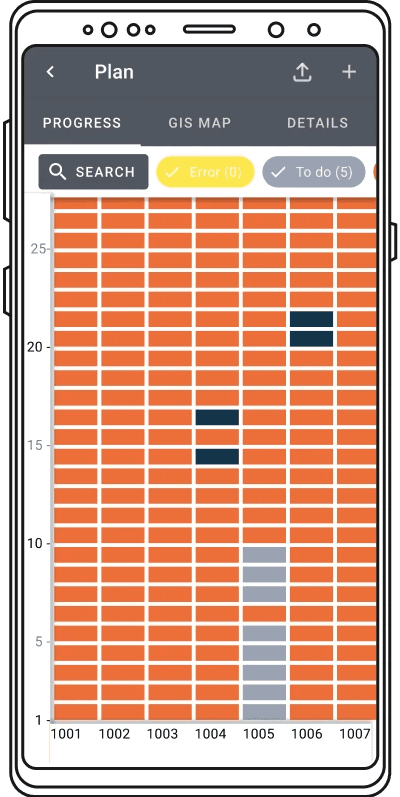
06 Filtering
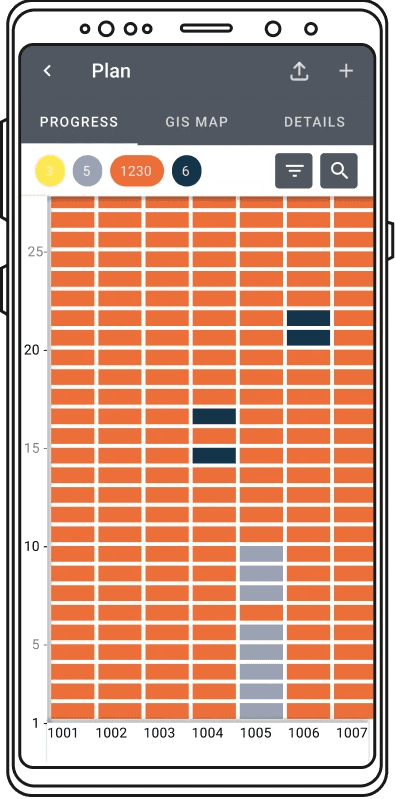
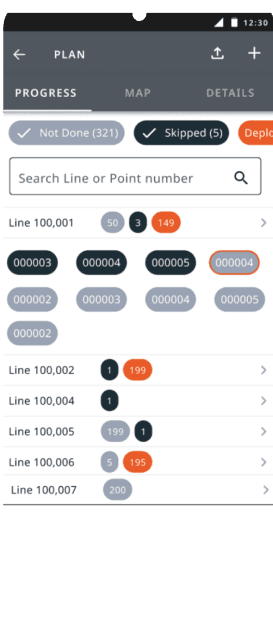
Our commitment to Material Design 2.0 initially led us to filter chips for controlling plan status. However, users:
Changing to a filter icon and dropdown took comprehension from a 100% failure rate to a 100% pass rate in testing.
Further research during usability testing revealed a crucial missing piece: a way for Navigators to focus on their own tasks, often assigned by Foremen. We added this to the filter dropdown, so Navigators can view their designated tasks while still using other filters.
07 Colour
Our predefined colours didn’t emphasise what every user cared about: what is left to do? We reworked the colour order to give more prominence to what’s left, or not right, than what’s done.
We also improved accessibility: most users are men, and two colleagues were colour blind.

08 A new requirement
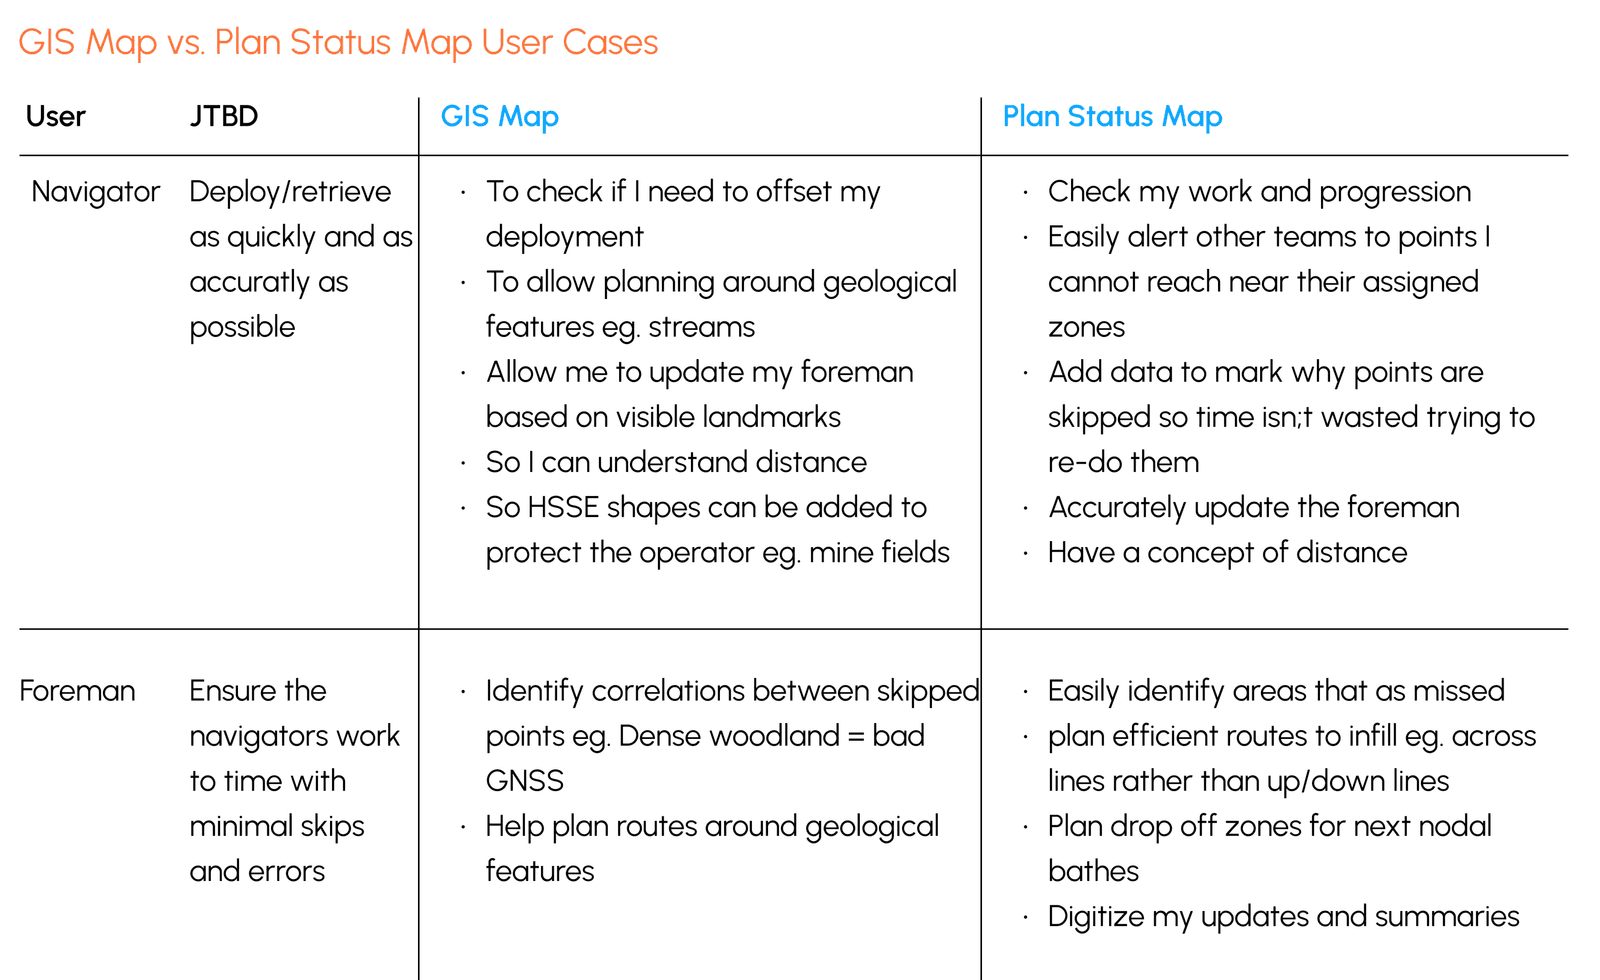
Because of cost, we had always avoided a GIS (geographic information system) map, but the research suggested we should provide both.
The plan status map lets users see groups of areas to fix or do, plan segments and work out efficient clusters of work for different teams. The GIS map solves different but important use cases, particularly for Foremen and Navigators.
The Product Manager took this new requirement on board. Because we build iteratively in MVP style, it will come later, as there are workarounds using software on the laptops.
“Is this real? When can we start using it?”
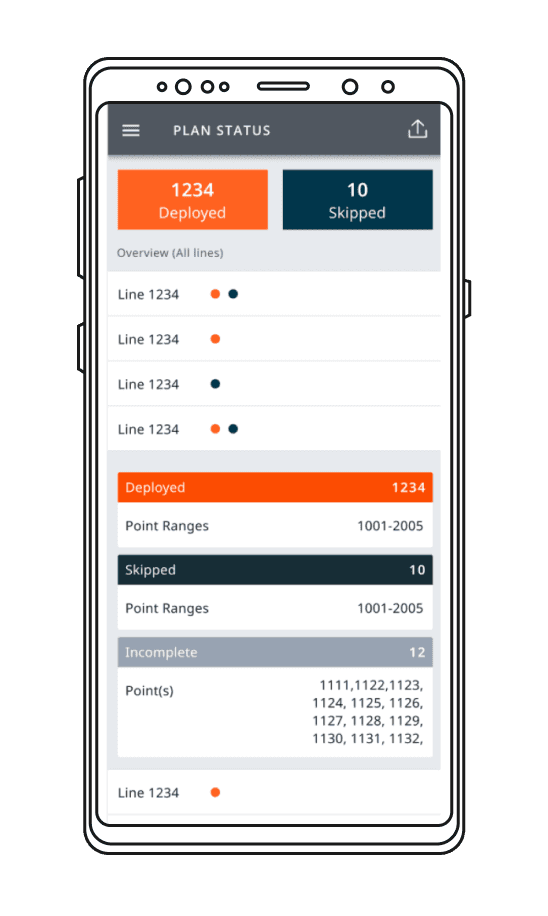
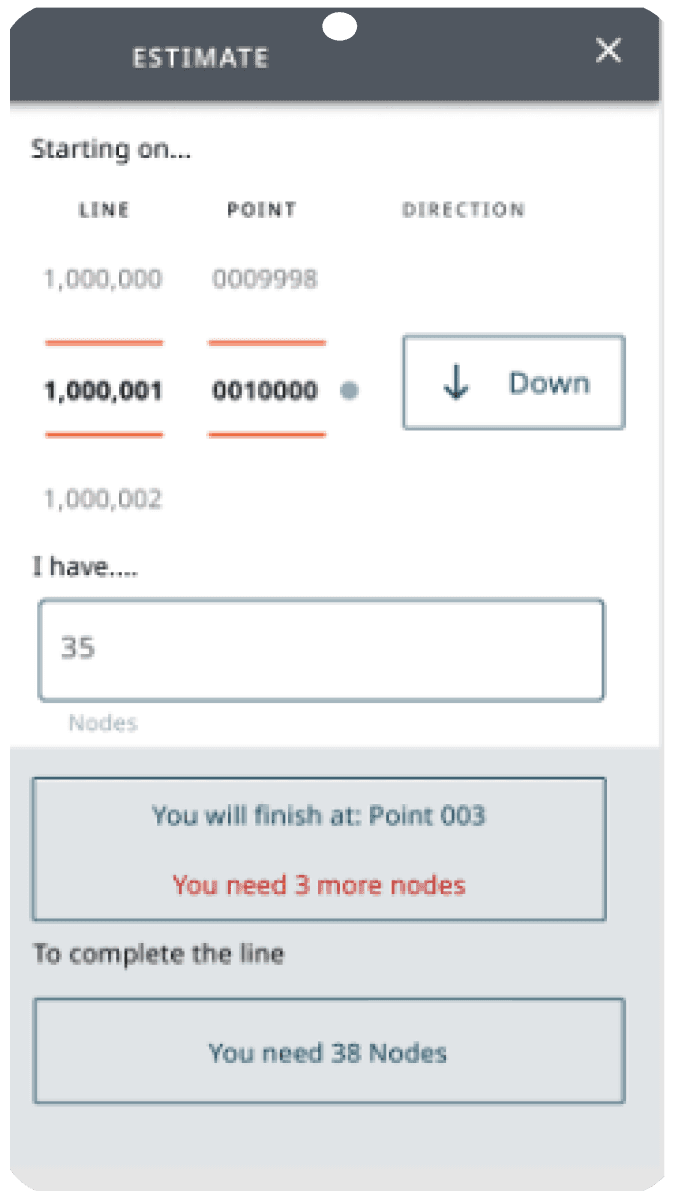
Field support suggested helping crews plan trips: how many nodes to carry and where to drop them. It was explored, then judged a better fit for STRYDE’s pre-field planning software.
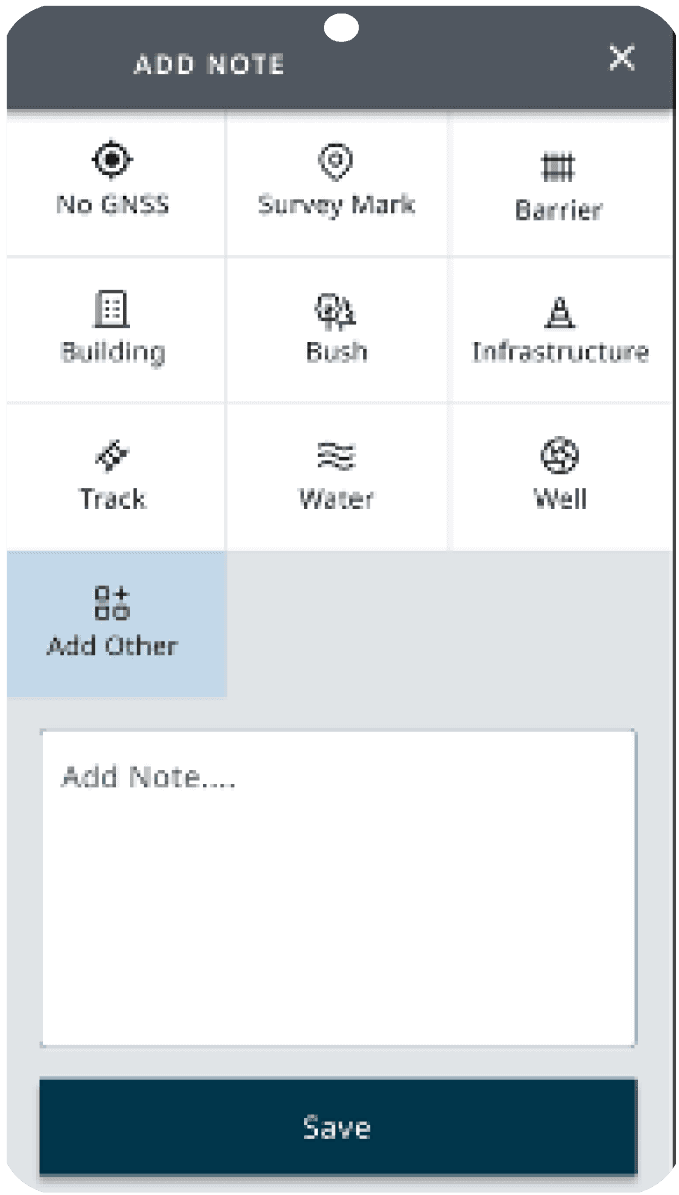
Letting Navigators note why they skipped a point (impassable terrain, GPS issues) could save Data Officers unnecessary field visits. Widely liked, but it needs more testing.
The most common mistake is assigning a node to the wrong point and repeating it down the line. A heat map would help, but Navigators rarely check plan status, so this is better solved on the navigation screen.
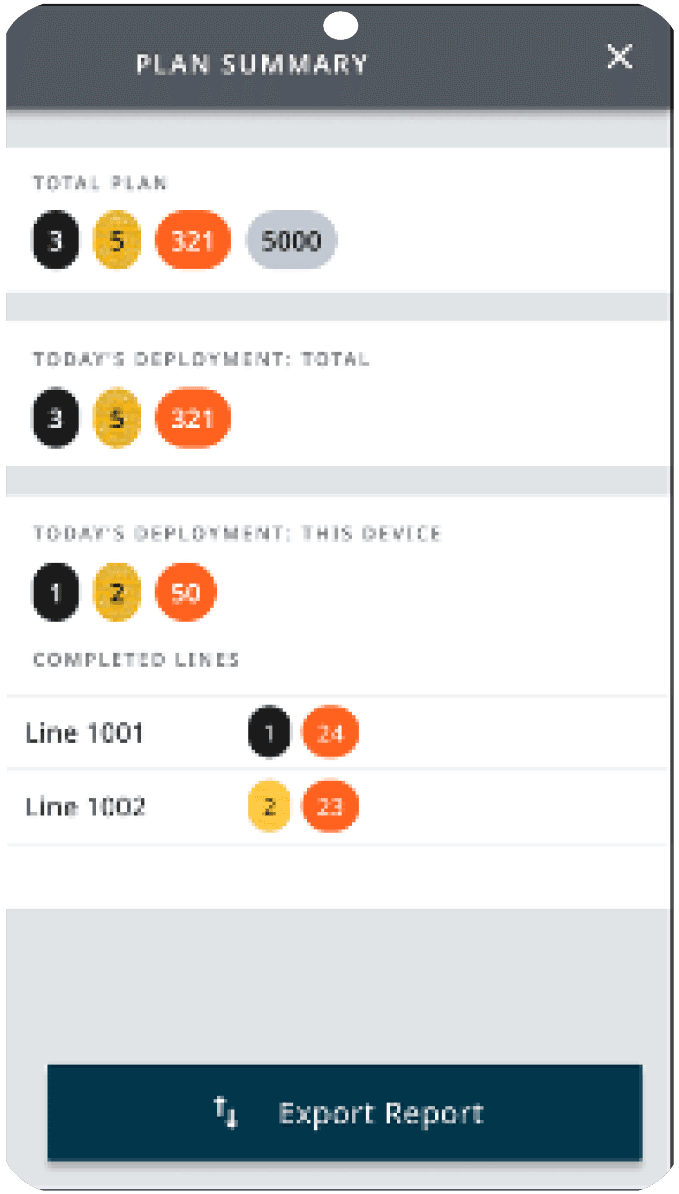
A summary by device and by day for Data Officers and Foremen who report to different managers: an extension of plan status with a full overview.